TrueNAS Telegraf, Influx, Grafana#
|
|
|
|
This guide will explain how to setup Telegraf, InfluxDB, and Grafana on TrueNAS SCALE (Community Edition). This is how I run all three apps on my Beelink ME Mini NAS. As of this writing I’m running TrueNAS SCALE 25.04.1 (Fangtooth). The scope of this guide is to implement homelab-tier monitoring on a single node.
Telegraf, InfluxDB, and Grafana are separate pieces of software that together allow you to graph metrics from your servers and devices. With these graphs, charts, and other visualization tools available in Grafana, you can see historical trends of space usage, CPU usage, and almost anything else. The three components make up the “TIG Stack”, where Telegraf collects the data, InfluxDB stores the data in a kind of database, and Grafana produces the graphs and alerts.
Ever since I saw MRTG graphs at my first job at an ISP in 2003, I’ve always wanted to collect metrics and visualize them in graphs. Things like free disk space or CPU temperatures. I ran MRTG on my homelab file server for a few years, then tried RRDtool for a bit. It was in 2015 at Uber where I learned about Grafana and fell in love with it. Not so much the Graphite backend they were using at the time. I first started running my own Grafana at home in 2017 with InfluxDB and Telegraf.
See also
This guide is written for InfluxDB v2, which is the version used by the latest TrueNAS app at this time. An earlier version of this guide was written for InfluxDB v1. You can access it here: Robpol86/robpol86.com
Prerequisites#
Before starting there are a few things we need to setup.
Choose a Pool#
The first step for enabling apps on TrueNAS is to select a pool. In a typical home NAS you’ll probably only have one pool where you store all of your files; go ahead and select that pool. On my NAS I’ve named my pool Vault. Substitute that with your pool’s name.
In the TrueNAS UI go to ➡️ Apps
Click on Configuration and then Choose Pool
Select a pool (e.g. Vault)
Create Datasets#
Next we’ll be creating a few datasets. We’ll create a dataset named Apps just for organization, and within it we’ll create datasets for each individual app. This is the structure we’ll be using:
Vault (pool)
└── Apps
    ├── InfluxDB-Config
    ├── InfluxDB-Data
    ├── Grafana-Plugins
    ├── Grafana-Data
    └── Telegraf
In the TrueNAS UI go to ➡️ Datasets
Click on Vault then Add Dataset
Name: Apps
Dataset Preset: Apps
Save
Click on the new Apps dataset then Add Dataset again
Name: InfluxDB-Config
Dataset Preset: Apps
Save
Return to Pool List
Repeat for InfluxDB-Data, Grafana-Plugins, Grafana-Data and Telegraf
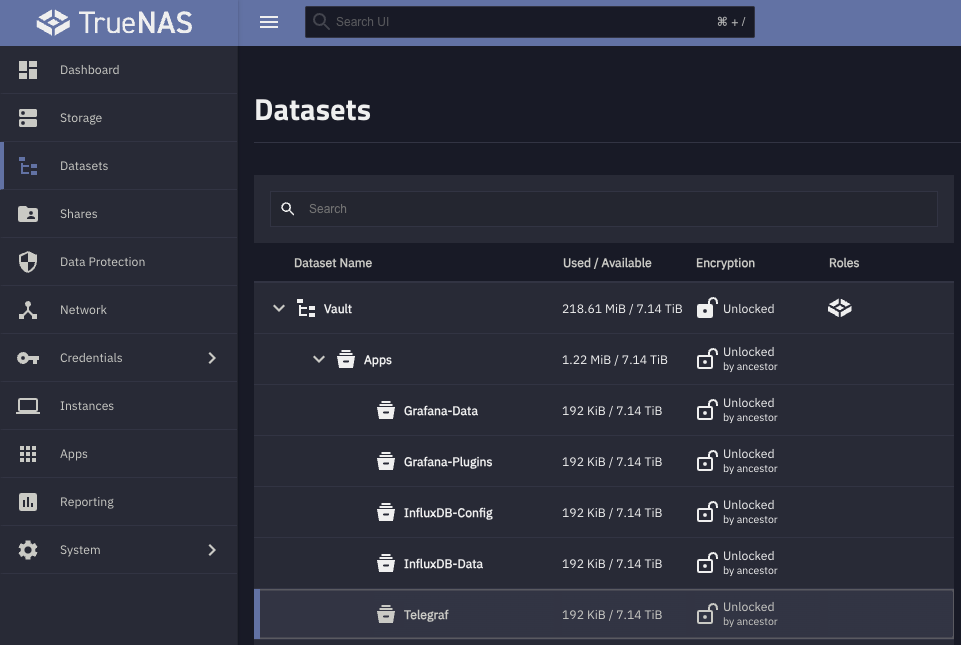
You should now see something like this.#
InfluxDB#
We’ll be using the official InfluxDB TrueNAS app as the timeseries database to store all of our metrics.
In the TrueNAS UI go to ➡️ Apps
Click on Discover Apps
Search for InfluxDB and install it
In the “Install InfluxDB” screen make these changes:
Network Configuration
WebUI Port
Port Number: 8086
Storage Configuration
InfluxDB Config Storage
Type: Host Path
Host Path: /mnt/Vault/Apps/InfluxDB-Config
InfluxDB Data Storage
Type: Host Path
Host Path: /mnt/Vault/Apps/InfluxDB-Data
Then click Install
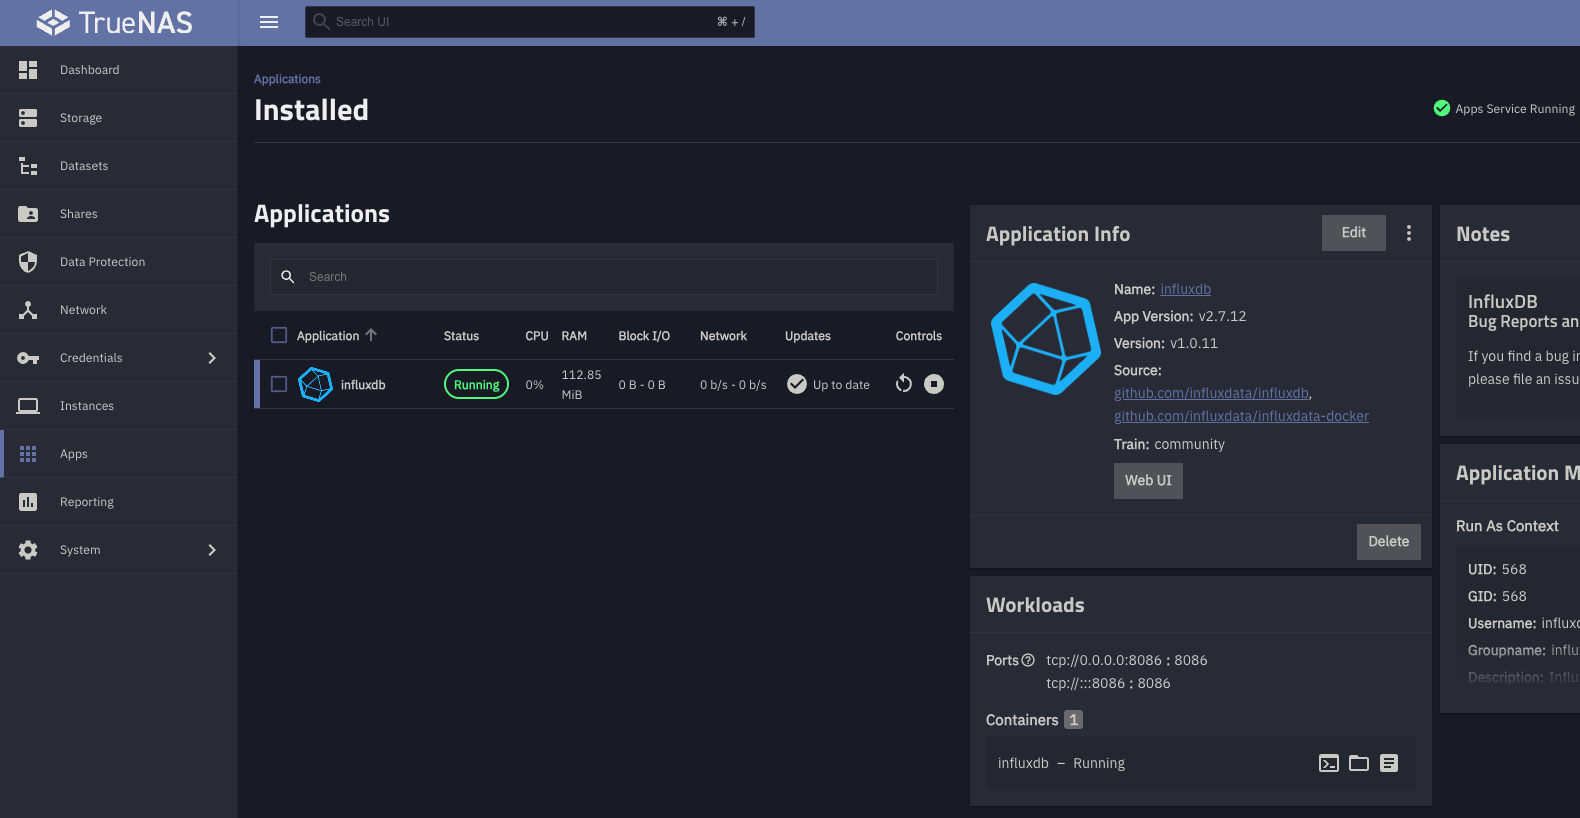
After you click “Install” you should see something like this.#
Initial Setup#
Once the application is “Running” click on it. Under “Application Info” click on Web UI. You’ll see a “Get Started” button. Click on it and then fill out the form with these values:
Username: admin
Initial Organization Name: homelab
Initial Bucket Name: telegraf
Click Continue then Quick Start
Generate Tokens#
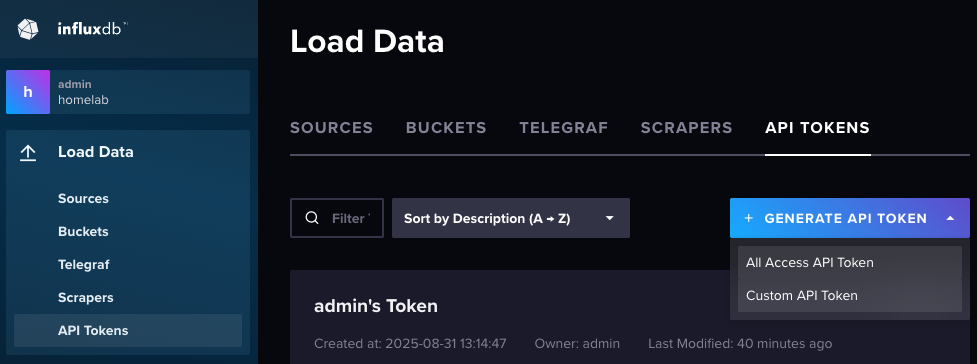
Next we need to create a token for Telegraf to use for writing, and another token for Grafana to use for reading. In the web UI expand the sidebar (there’s an icon in the lower left corner) and go to:
Load Data
API Tokens
Generate API Token
Custom API Token
For Telegraf:
Description: telegraf-truenas
Buckets > telegraf > Write: Check
Generate
Write down the presented token for later, you won’t be able to see it again
Then repeat the process for Grafana:
Description: grafana
Buckets > telegraf > Read: Check
Generate
Write down the presented token for later, you won’t be able to see it again
Telegraf#
Most guides and posts on the internet show how to run Telegraf from a Docker container with /sys and other filesystems
mounted as well as running in privileged mode. I personally don’t like that approach, so instead I just run Telegraf as root
on “bare metal” (as in not in a container or in a VM).
Warning
Running Telegraf on bare metal is not officially supported by TrueNAS. This implementation may stop working on future versions of TrueNAS SCALE if they stop including the commands we need.
To get started download three files and save them in /mnt/Vault/Apps/Telegraf/:
telegraf.conf unmodified
telegraf.env with “REPLACE_ME” replaced
Use the telegraf-truenas token you generated in the Generate Tokens section
telegraf from the latest linux_amd64 release
Extract the tar.gz file and look for the
telegraffile inusr/bin
Hint
If you run ls -lah /mnt/Vault/Apps/Telegraf you should see something like this:
total 120M
drwxrwx--- 2 root          root    5 Aug 31 13:37 .
drwxrwx--- 5 root          root    5 Aug 31 12:43 ..
-rwxrwx--- 1 truenas_admin root 284M Aug 31 13:37 telegraf
-rwxrwx--- 1 truenas_admin root 2.2K Aug 31 13:37 telegraf.conf
-rwxrwx--- 1 truenas_admin root  104 Aug 31 13:37 telegraf.env
Run on Boot#
Here we’ll configure TrueNAS to run Telegraf on boot by using a post-init command. This command will use systemd-run to
launch Telegraf and handle things such as logging, restarting on failures, and environment variables.
In the TrueNAS UI go to ➡️ System > Advanced Settings
Add an Init/Shutdown script
Description: Telegraf
Type: Command
When: Post Init
Command:
/bin/systemd-run --no-block --unit telegraf -p User=root -p Restart=always -p RestartSec=30 -p EnvironmentFile=/mnt/Vault/Apps/Telegraf/telegraf.env /mnt/Vault/Apps/Telegraf/telegraf --config /mnt/Vault/Apps/Telegraf/telegraf.conf
You can now reboot, or if you don’t want to you can run the command with sudo.
Tip
To view Telegraf logs run: sudo journalctl -u telegraf
To stop Telegraf run: sudo systemctl stop telegraf
TrueNAS Graphite Exporter#
TrueNAS supports exporting some metrics. Here we’ll tell it to export them to Telegraf. They’re not used in my dashboard but you might find a use for them.
In the TrueNAS UI go to ➡️ Reporting
Click on Exporters then Add
Name: Telegraf
Type: GRAPHITE
Destination IP: localhost
Destination Port: 2003
Prefix: graphite
Namespace: truenas_reporting
Update Every: 10
To confirm this works you can go into the InfluxDB web UI then click on Data Explorer:
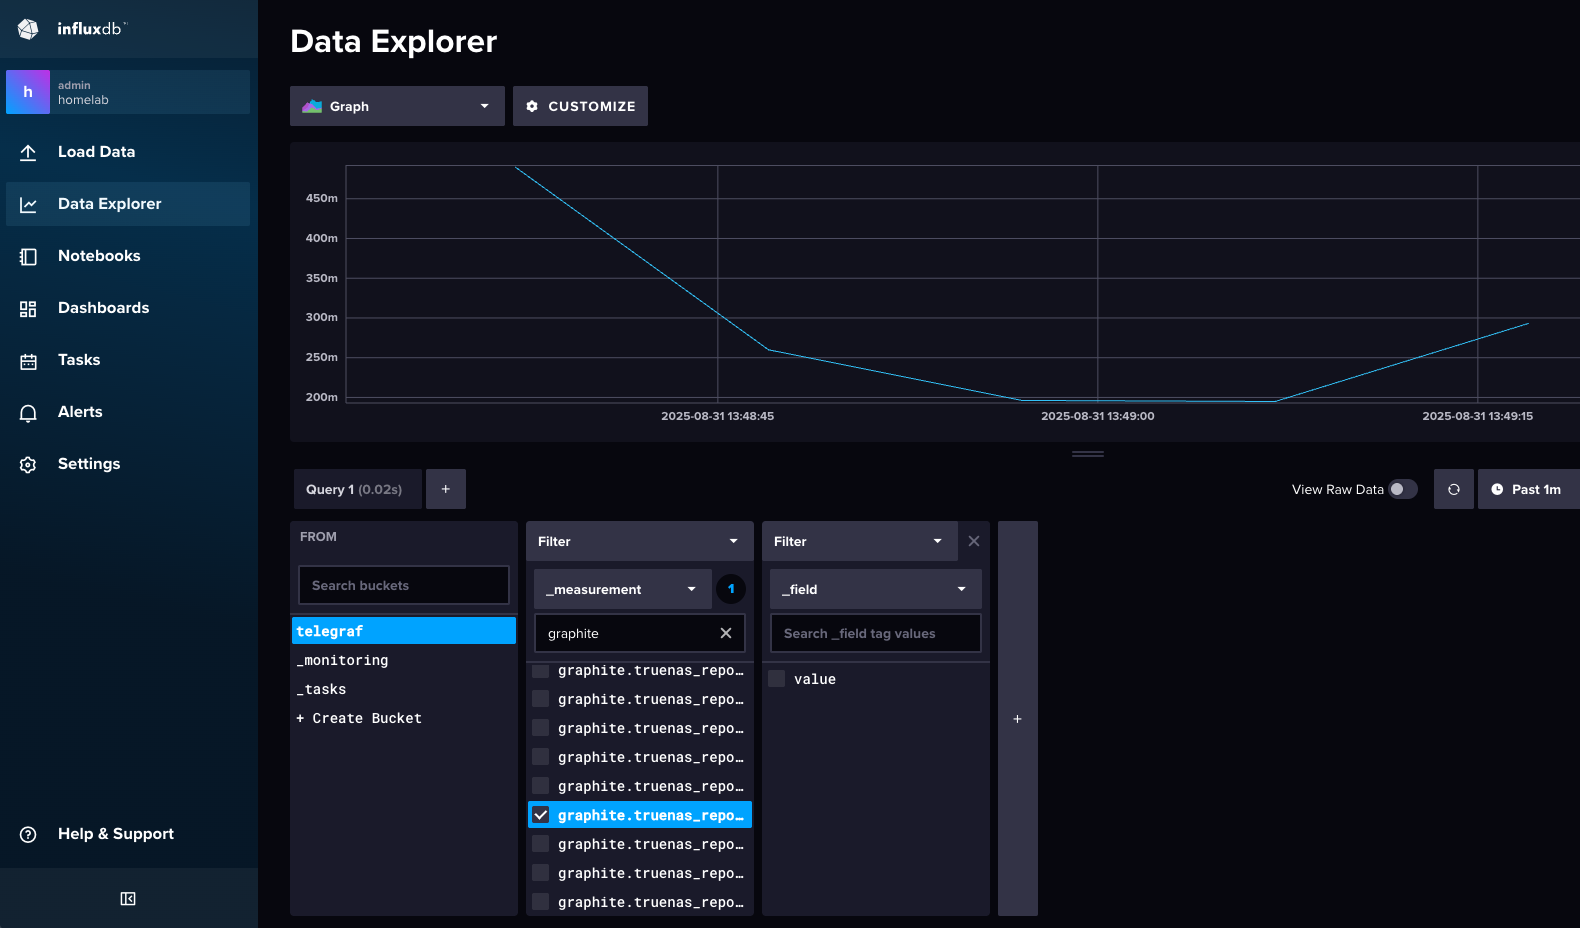
You should see a lot of graphite.* measurements in the telegraf bucket.#
Alerts#
I’d like to be notified if InfluxDB isn’t recording metrics. We’ll accomplish this by reappropriating the built-in ApplicationsStartFailed alert.
In the TrueNAS UI go to ➡️ System > Advanced Settings
Add an Init/Shutdown script
Description: Telegraf Health
Type: Command
When: Post Init
Command:
/bin/systemd-run --on-calendar='*:*:00' --unit telegraf-health sh -c 'curl -sSf http://localhost:12121 -o /dev/null || midclt call alert.oneshot_create ApplicationsStartFailed "{\"error\": \"telegraf unhealthy\"}"'
Note
Every minute a systemd timer will poll the outputs.health endpoint in telegraf.conf and fail if
Telegraf isn’t running or if Telegraf hasn’t been sending metrics to InfluxDB.
The way Telegraf’s health endpoint is implemented is a bit confusing. If Telegraf isn’t able to send metrics to InfluxDB,
they pile up in its internal memory buffer. When the number of buffered metrics crosses a threshold (configured in
outputs.health.compares) the health endpoint starts responding with an http 503 error (typically 5 minutes after InfluxDB
has gone down). When InfluxDB is restored Telegraf will re-send these buffered metrics and the health check will return to an
http 200 OK state.
Fan Speed#
This step is optional and specific to the Beelink ME Mini. Out of the box the CPU fan speed isn’t reported because of a missing kernel driver. I wrote a workaround that compiles and installs the driver into TrueNAS to see the current fan RPM in the dashboard.
Danger
Do this at your own risk. Custom kernel drivers are 100% not officially supported by TrueNAS.
In the TrueNAS UI go to ➡️ System > Advanced Settings
Add an Init/Shutdown script
Description: Telegraf it87
Type: Command
When: Post Init
Command:
/bin/systemd-run --unit telegraf-it87 -p User=root sh -euxc 'if ! sensors |grep -P "^fan.?:"; then until systemctl is-active docker.service; do sleep 10; done; echo "FROM ubuntu AS build\nRUN apt-get update && apt-get install -y git make gcc\nWORKDIR /source\nRUN git clone https://github.com/frankcrawford/it87 .\nCOPY --from=usrlib modules /lib/modules\nCOPY --from=usrlib x86_64-linux-gnu/libelf.so.1 /usr/lib/x86_64-linux-gnu/\nCOPY --from=usrsrc . /usr/src\nRUN make\nFROM scratch\nCOPY --from=build /source/it87.ko ." |docker build --build-context usrlib=/usr/lib --build-context usrsrc=/usr/src --output=/var/run/it87 -; mount -o remount,rw /usr; cp /var/run/it87/it87.ko "/usr/lib/modules/$(uname -r)/kernel/drivers/hwmon/"; mount -o remount,ro /usr; echo it87 |tee /etc/modules-load.d/it87.conf; modprobe it87; fi'
Reboot or run the command with sudo.
Grafana#
We can use the offical Grafana TrueNAS app to visualize our metrics and draw pretty graphs. It also supports alerting you through email, Discord, Slack, and other methods (however I won’t be covering Grafana alerts in this guide).
In the TrueNAS UI go to ➡️ Apps
Click on Discover Apps
Search for Grafana and install it
In the “Install Grafana” screen make these changes:
Storage Configuration
Grafana Data Storage
Type: Host Path
Host Path: /mnt/Vault/Apps/Grafana-Data
Grafana Plugins Storage
Type: Host Path
Host Path: /mnt/Vault/Apps/Grafana-Plugins
Then click Install
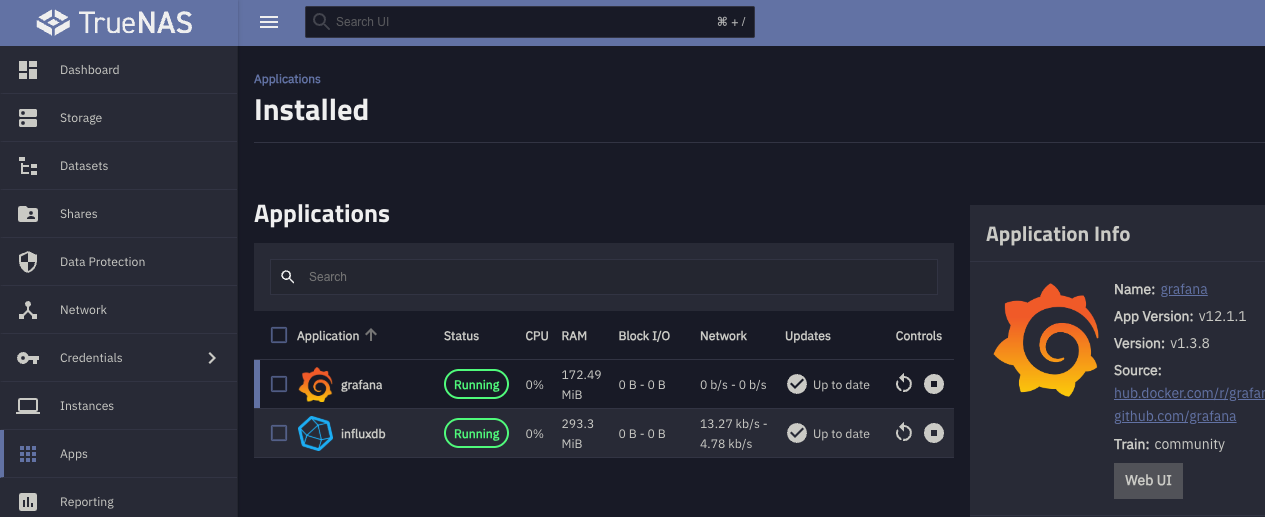
After you click “Install” you should see something like this.#
Grafana Configuration#
Once the application is “Running” click on it. Under “Application Info” click on Web UI. The default username and password are both “admin”.
After you set a new admin password expand the sidebar (click on the Grafana logo in the upper left corner) and do the following to set up Grafana with our InfluxDB application:
Connections > Data sources > Add data source > InfluxDB
Name: influxdb
Query language: Flux
URL:
http://172.16.0.1:8086This is the Docker network IP that InfluxDB runs in
Auth: Disable all
InfluxDB Details
Organization: homelab
Token: Use the grafana token you generated in the Generate Tokens section
Default Bucket: telegraf
Save & test
It should say something like: datasource is working. 1 buckets found
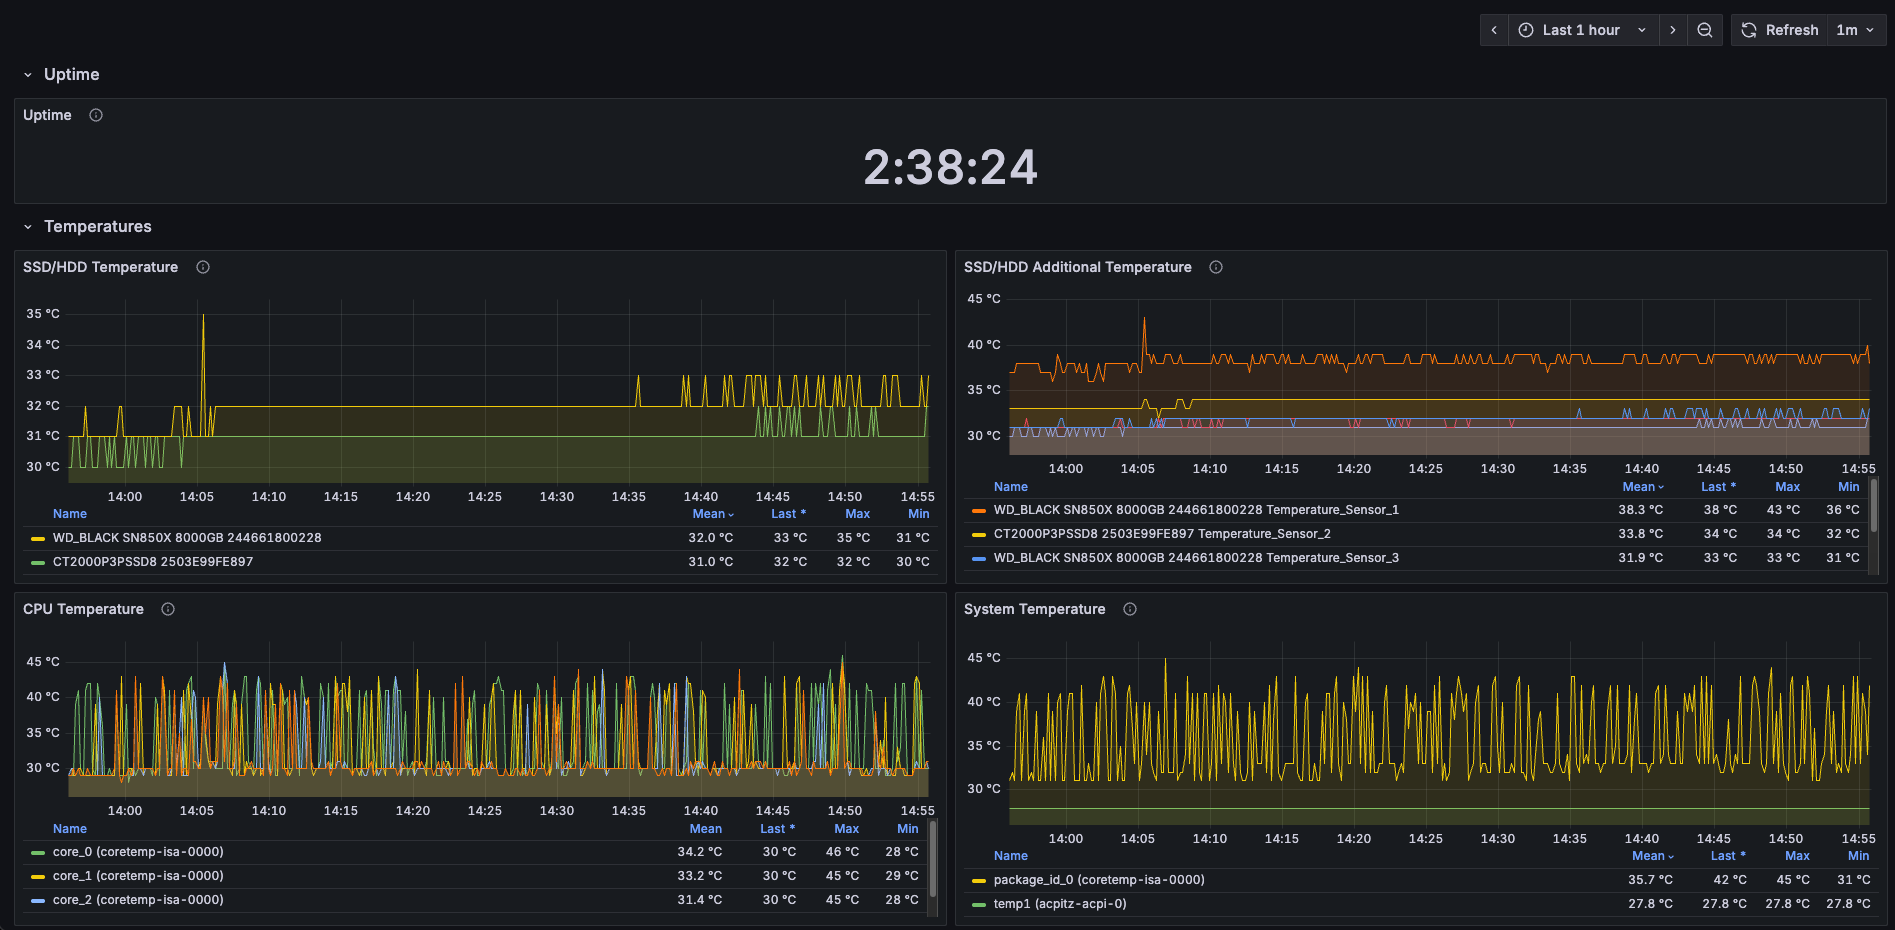
You can now create a new dashboard or import mine and go from there. To import mine:
Dashboards > New > Import
Upload my grafana.json
influxdb > Select a InfluxDB data source: influxdb
NAS_HOST: your NAS hostname
Find this hostname in the main Dashboard page of the TrueNAS UI, under System Information
Import
I like to make this dashboard the default page for Grafana, so when I go to the Grafana web UI it takes me directly to my graphs. To do that in the Grafana web UI go to:
Upper right avatar icon > Profile > Preferences
Home Dashboard: Dashboards/NAS
Save
Conclusion#
You should now have the TIG Stack running on your NAS. Feel free to add or remove panels in the dashboard to see the
metrics you’re interested in. You can also monitor additional components of your homelab by editing the telegraf.conf file.
You can read more about Telegraf
input plugins here. If you have any questions or
suggestions feel free to leave a comment below.
Comments
comments powered by Disqus